

Ingestion
Extract and load
Loaded Shopify, Unicommerce, GA4, Google Ads and Meta Ads into BigQuery with dlt and Mage. At Ocular, our platform pulls from ad platforms, marketplaces, quick commerce and logistics into one lakehouse.


Data Engineer
building the AI-native analytics brain for omnichannel brands from the ground up at  Ocular. Sole engineer on client data platforms across dbt, BigQuery, Trino and Iceberg. Shipped 33 marketplace models in one release, own 15 Power BI dashboards for one client, and build the semantic layer that 14 brands ask their dashboards and AI agents from. Graduated in Information Technology from TTCET, University of Mumbai.
I work across the whole data stack, from the first API call to the number on the dashboard. Most of it has been for commerce and advertising data, where ten sources disagree and someone still has to sign off the total.
Ingestion
Loaded Shopify, Unicommerce, GA4, Google Ads and Meta Ads into BigQuery with dlt and Mage. At Ocular, our platform pulls from ad platforms, marketplaces, quick commerce and logistics into one lakehouse.
Processing
Spark for batch transforms, and at Ocular our team processes GA4 event exports with Spark. Trino over Apache Iceberg on S3 for the lakehouse, BigQuery with partitioning and clustering for the warehouse.
Modeling
Staging to facts across multi-tenant schemas, covering sales (Shopify, Unicommerce), marketplaces, quick commerce, inventory and ads. Incremental models, deduplication, slowly changing snapshots, and unified models that put several platforms on one grain.
Semantic layer
Measures, dimensions and business context in Cube, so dashboards and AI agents answer from the same definitions. Each member carries synonyms and usage context, so an agent picks the right one.
Reporting
Power BI and Looker Studio for sales, margin, advertising and field performance, including DAX fixes where a slicer and a measure silently disagreed.
Reliability
Freshness, uniqueness and parity checks against raw, plus reconciliation against the source platform when a number is challenged.
Fornax · Data consulting
– Present
Product · Omnichannel analytics
Building the AI-native analytics brain for omnichannel brands, from the ground up.
I built dbt models that bring data from ads, storefronts, marketplaces, quick commerce and logistics into a shared analytics layer. Running on an AWS lakehouse with S3, Apache Iceberg and Trino, these models support reporting on sales, returns, ad performance, customer behavior and profitability.
I defined business measures and dimensions in the semantic layer so dashboards and AI agents can use the same definitions. I added synonyms and usage guidance to help agents map plain-English questions to the right metrics.
Client engagement · Australia · Sole engineer
I owned the ingestion layer from the client’s ERP into BigQuery and built dbt models that brought sales transactions, customers, products and costs into one reporting layer. I added freshness and reconciliation checks to flag stale loads and discrepancies with the ERP.
I owned 15 Power BI dashboards for sales, margin, customer profitability and field team performance, and put them under version control for the first time. I am building a shared semantic layer so dashboards and AI agents use one definition of each business metric.
Read the case study ↓Client engagement · D2C commerce · Sole engineer
I set up ingestion from Shopify, Unicommerce, GA4, Google Ads and Meta Ads into BigQuery. I used dbt to model sales, advertising, inventory and logistics in one reporting layer.
I used partitioned incremental loads to reduce unnecessary scans and added tests for uniqueness, missing values and source freshness.
Dharma Diamonds
–
I built a PostgreSQL reporting layer from Excel, CSV and accounting exports. I reconciled procurement, inventory and sales records without a shared product ID, sending ambiguous matches for manual review.
I prepared SQL datasets for Power BI reporting on inventory, suppliers, sales and gross margin.
Australian wellness brand · Sole engineer · dbt on BigQuery
An error that named no row, and an obvious fix that would have erased the table’s entire change history.
Personal builds and demos, outside client work.
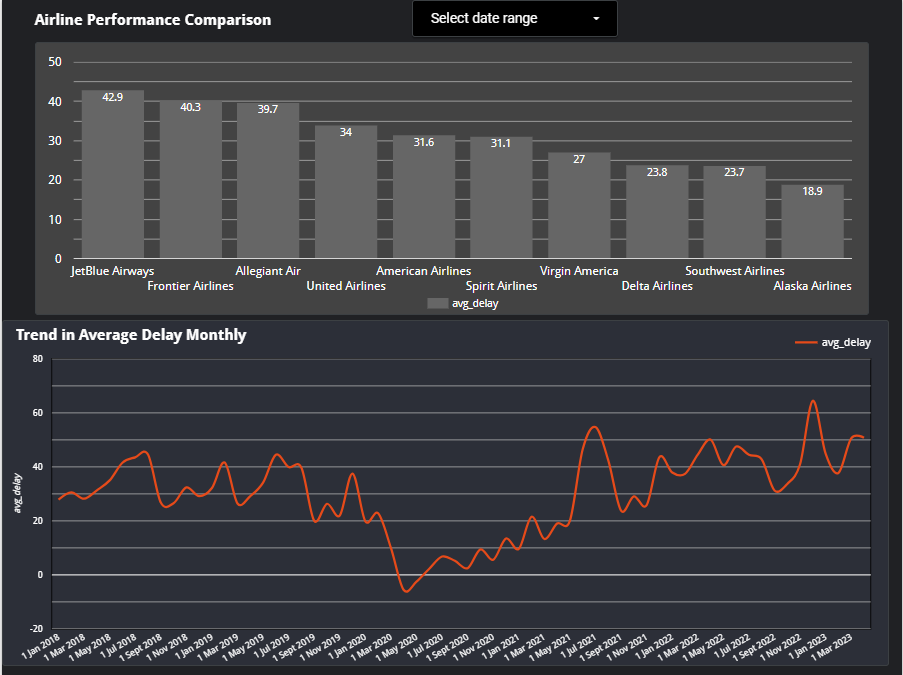
Data engineering · Personal project
An end-to-end pipeline for analyzing U.S. flight delays by airline, airport, and time period.
Raw Parquet lands in Cloud Storage. Mage orchestrates Spark transforms, and partitioned, clustered BigQuery tables serve the Looker Studio report.

Analytics engineering · Dashboard demo
A reporting showcase for exploring advertising performance alongside sales.

Applied AI · Demo
A conversational analytics demo that answers business questions using metrics defined in a semantic layer.
Personal product · Applied AI
I built and used an app to organize my own trip plans, with AI as part of the planning workflow.
Warehouse performance
I used partitioned incremental loads to keep recurring BigQuery runs from scanning unnecessary history.
See the D2C work ↑Data reliability
I compared the latest date across tables and traced a stale report to a stuck ingestion cursor.
Read the incident write-up ↓Semantic modeling
I defined measures, dimensions and business context in a shared semantic layer at Ocular.
See the product work ↑ Related reading from GobbleCube ↗Information Technology · University of Mumbai
CGPA 9.3 / 10
Writing
How I think through data modeling and reporting problems.
I was shipping 33 deduplication models for marketplace data. They compiled, ran, had zero duplicate keys and matched raw row counts. A full refresh followed by an incremental run also looked clean.
That test hides the bug, because a full refresh rebuilds from scratch. I replayed the real daily run order instead. When a source re-sent a document with fewer lines than before, the incremental MERGE updated the lines that still existed and left the dropped ones in place. One ledger was carrying 1,070 phantom units.
MERGE on a line-level key can update and insert, but it has no reason to delete. I switched the ledger and snapshot tables to delete+insert on the document or day key, so each run replaces the whole group. Then I proved it with a three-run key test: full refresh, a repeated window, and an overlapping new window. It passed 96 of 96.
A QC sheet showed nothing matching between an ad platform’s exports and our reporting layer: spend at four times the platform figure, most product rows missing.
Before touching a model I joined raw to modelled data on ids. All 22,644 matched, which cleared the transformation layer in one query. Matching on names made 17.5% of rows look missing; dropping the campaign name from the key rematched every one, because nine campaigns had been renamed.
What remained was real but expected. We loaded each day once, a day or two later, and the platform kept revising it afterwards. The proof was a control: months that had been loaded 50 or more days late matched exactly. The outcome was 12 of 13 models certified, one real bug isolated, and a re-pull window for the loader.
Imagine a daily sales model that starts as a view. It’s easy to iterate on while the definition changes. If repeated reads become expensive, a table is worth evaluating. If rebuilding that table becomes the bottleneck, look at processing only the records that changed.
An incremental model adds questions about late updates and backfills. I’d compare a run after late-arriving data with a full rebuild and verify that both produce the same totals for the affected days.
Suppose two reports show different revenue for the same day. First align the filters and metric definition, then compare totals before and after each join. In this example, one report joins orders to items and sums the order total after the join. An order with three items contributes its total three times.
Keep order totals at one row per order. Reconcile the daily totals against the order source and include a multi-item order in the regression test.